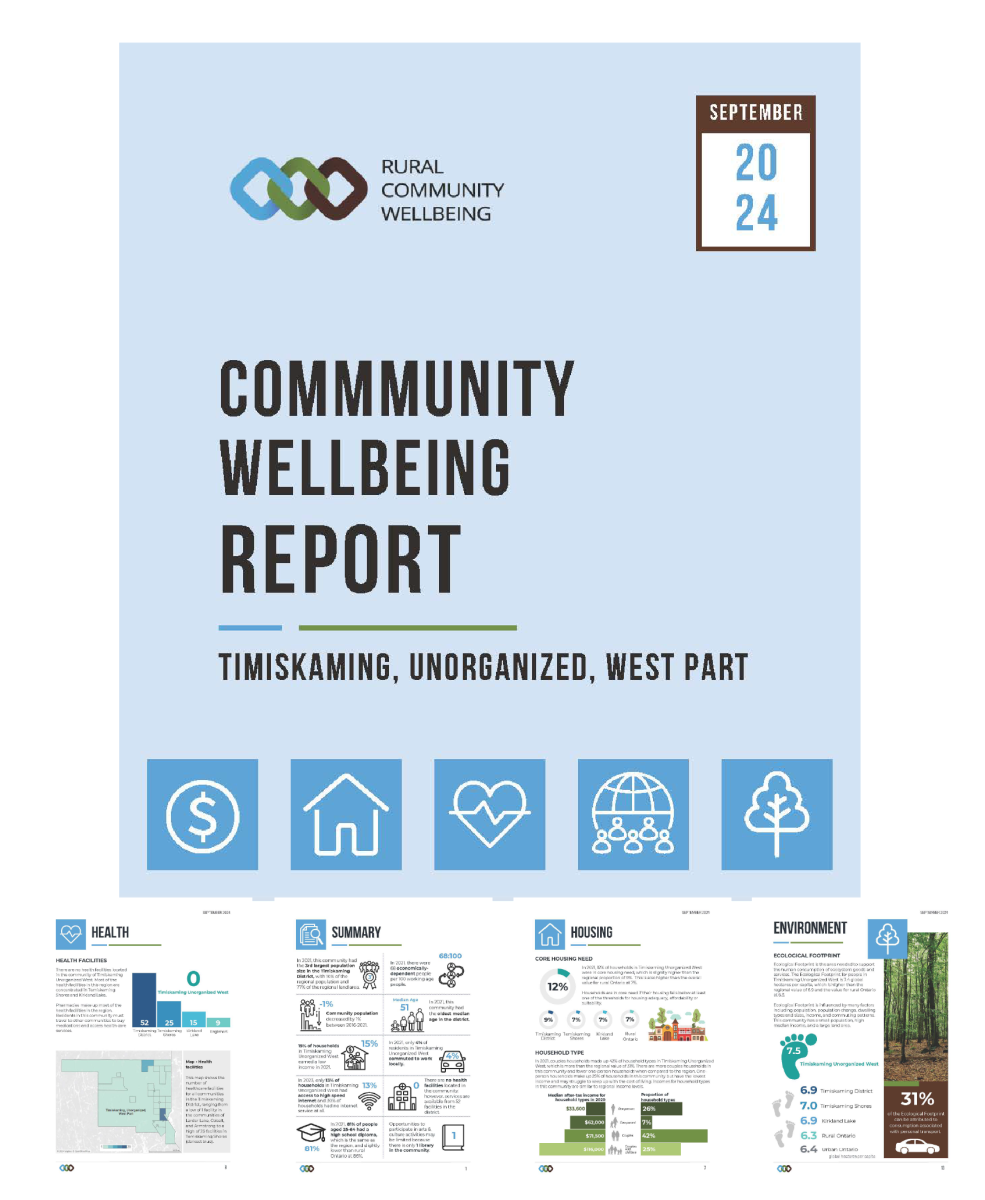
 The Community Wellbeing Dashboard can help you understand what is happening in your community. ROI would be pleased to provide your community with a wellbeing report for a reasonable cost-recovery fee.
Click here to view a sample custom report prepared for the Timiskaming Health Unit.This custom report expands on the standard report to include more detail about households and the environment.
Reports include maps, infographics, indicator data, and visualizations from the dashboard. Reports are brief and can be used to support research, planning, policy development, and progress measurement. Reports can include a section for community commentary, if a community would like to contextualize indicator data or promote wellbeing initiatives.
Each report includes a basic set of contextual indicators:
- Community type/classification
- Population
- Population density
- Population change
- Population dependency ratio
- Median age
- Age distribution
- Median household income
- Top employment industry
- Population diversity
You can choose other indicators to add to your report depending on your community’s needs, interests, and budget. Contact us for more information or a quote.
- Standard Wellbeing Report: $3,500
-
This report provides an overview of wellbeing for your community using a standard set of indicators from across all categories.
In addition to the contextual indicators, the standard report also includes the following indicators:
- Household income distribution
- Low-income measure
- Household types and income
- Local employment
- Change in jobs 2018-2022
- Internet
- Core housing need
- Unaffordable housing
- Number and types of health facilities
- Wait times for long term care
- Number of calls for mental health services & reasons for calling
- Number & types of arts & culture facilities
- Highest level of education achieved
- Spotlight Wellbeing Report: $5,000
-
This report provides an exploration of wellbeing that features cross-cutting indicators to tell a holistic story about a specific topic.
The spotlight report includes the contextual indicators, along with 10-15 additional indicators.
You can choose from the following spotlight topics:
Social Determinants of Health
- Number and types of health facilities
- Wait times for long term care
- Number of calls for mental health services & reasons for calling
- Household income distribution
- Low-income measure
- High school diploma
- Post secondary education
- Highest level of education achieved
- Core housing need
- Unaffordable housing
- Inadequate housing
- Unsuitable housing
- Household types & income by type
- Shelter costs
Economic Development
- Household income distribution
- Median individual Income
- Low-income measure (individual)
- Work activity
- Casual employees
- Worked from home
- Jobs by industry 2018-2022 & change in jobs 2021-2022
- Local employment
- Households with 50/10 broadband service
- Usual residents
- Shelter costs
- Commute by car, truck, or van
- Commute duration
- Number and types of arts & culture facilities
- Revenue of charitable arts organizations
Sustainability
- Ecological Footprint
- Biological capacity
- Biocapacity balance
- Hottest day
- Coldest day
- Length of winter season
- Days with Humidex > 35
- Length of growing season
- Total precipitation
- Main mode of commuting
- Duration of commute
- Protected areas
- Household size
- Dwelling type and size
- Household income distribution
- Custom Wellbeing Report: Request a Quote
-
This report provides a customized perspective of your community’s wellbeing based on your priorities and interests.
Custom reports can range from a brief 2-page infographic snapshot to an expanded version of the other reports, or a companion analysis of specific indicators.
Custom reports may also be translated into French.
Please contact us for a quote and/or an assessment of your data needs.